

The problem it solves
Between "the business knows what it wants to see" and "a finished report exists" there traditionally sits a lossy translation process: notes, screenshots, hallway conversations, emails, a few PowerPoint boxes. Every step loses information, and in the end someone builds something that then gets nudged into shape over several rounds.
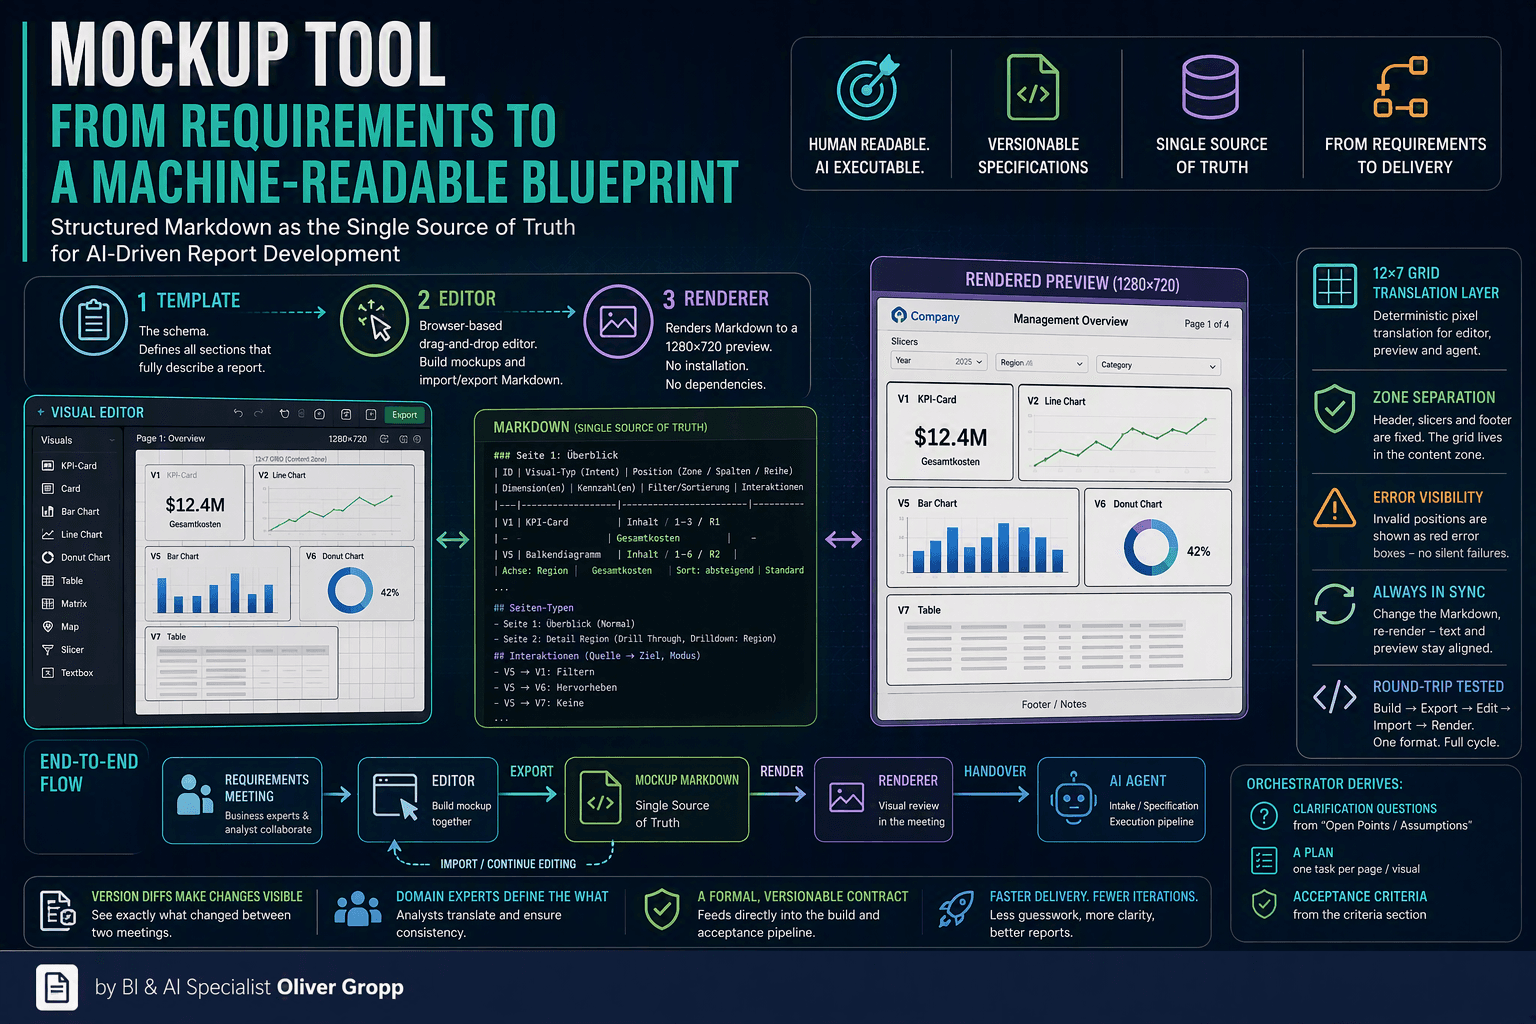
The Mockup Tool wedges a formal, versionable contract into exactly that gap. It does not produce pretty pictures for show — it produces a single source of truth that is at once readable by humans and precisely executable by an AI agent. The core trick: the binding artifact is structured Markdown, not an image.
The three building blocks
The tool is deliberately built as a small, dependency-light system — no backend, no build step, no installation.
| Building block | Role |
|---|---|
| Template | The schema. Defines the sections that describe a report completely from a business perspective. |
| Editor | Interactive drag-and-drop editor in the browser. Assembles the mockup and exports/imports the Markdown. |
| Renderer | Renders the Markdown into a true-to-scale 1280×720 preview. Runs without additional dependencies. |
All three speak the same Markdown format — round-trip tested. You can build in the editor, export, sharpen the Markdown by hand, import it again, or render it directly. The common denominator is always the Markdown file.
The heart of it: Markdown as a contract
A mockup is a Markdown file with header metadata and several numbered sections that describe the report completely from a business perspective. A typical excerpt from the "Pages & Visuals" section:
### Page 1: Overview
| ID | Visual type (intent) | Position (zone / columns / row) | Dimension(s) | Measure(s)   | Filter/Sort       | Interactions |
|----|----------------------|----------------------------------|--------------|--------------|-------------------|--------------|
| V1 | KPI card             | Content / 1–3 / R1               | –            | Total costs  | –                 | Default      |
| V5 | Bar chart | Content / 1–6 / R2 | Axis: Region | Total costs | Sort: descending | Default |The decisive move is separating two levels of bindingness:
- Binding are the business statements — which visuals, which dimensions, which measures, which filters.
- Approximate is the position. It is given as a coarse grid, not in pixels. The agent optimizes the fine placement itself.
That is the central design decision: the business should decide on content, not on pixel coordinates. The layout craft stays with the tool.
The 12×7 grid: the translation layer
Positions are noted in the mockup as a grid reference — e.g. Content / 1–6 / R2
means "columns 1 through 6, row 2". Behind it stands a binding 12×7 grid
with an exact, deterministic pixel translation. Both the preview and the agent
use the same conversion:
x      = 24  + (column - 1) * 104
width  = 104 * column_span - 16
y      = 204 + (row    - 1) * 72
height = 72 * row_span - 16Here 104 = 88 px cell width + 16 px gutter; 72 = 56 px cell height + 16 px
gutter. The parser is deliberately tolerant: it normalizes the various dash
characters (–, —, −), strips prefixes like R or zone names, and clamps
values into the valid range instead of failing hard on typos. Positions that
cannot be interpreted do not produce a silent error but a red-flagged error
box in the preview — which makes gaps visible during the meeting immediately.
Important is the zone separation: the grid sits entirely within the content zone. The header (logo, report title, page navigation), the filter/selection zone, and the footer are fixed frame elements of the corporate template and are not positioned by the business.
What the tool captures in report semantics
This is where it gets technically interesting, because the mockup is much more than a box sketch. It models real report concepts so the agent does not have to guess:
Visual types as intent. The editor knows a fixed type list (KPI card, card, bar, column, line, area, pie/donut chart, table, matrix, map, scatter plot, slicer, text box). These are internally clustered into five categories (KPI, chart, table/matrix, slicer, text), each getting its own sample graphic and accent color. "Intent" means: the business says "bar", the agent picks the concrete visual type.
Measures described in business terms, not technical ones. New measures are described in prose ("share of corrective measures in total costs") with an optional format and formula idea. The formula is explicitly optional — the agent derives it. The business does not need to know a formula language.
Page types. Each page can be marked as Normal, Drill Through, or Tooltip, plus a Hidden flag — exactly the common reporting model. Drill-through pages carry their drilldown fields; hidden pages disappear from navigation, just as in the real report.
Visual interactions as a matrix. Pairwise interactions (source → target) are encoded with the modes Filter / Highlight / None. This lets you specify in advance that a particular visual does not cross-filter others — a detail that is otherwise regularly requested only after delivery.
Slicer scope. Every global filter carries whether it acts on all pages or only a specific page.
Tooltip links. Tooltip pages are assigned to the visuals that should show them on hover.
These concepts are maintained in the editor via an inspector and, on export, serialized cleanly into the corresponding Markdown sections so that the preview and the agent find them again.
The preview is not a screenshot — it is a renderer
This is the point that is often misunderstood. The renderer parses the Markdown into an object model (pages, visuals, geometries, tooltip links) and renders from it, deterministically, the 1280×720 preview: header chrome, the drawn-in grid, each visual as a labeled box with ID, type, dimensions, and measures, plus a non-interactive sample graphic per type in the corporate theme colors.
The benefit: text and image stay always in sync, because the image is derived freshly from the text on every run. There is no "stale sketch" class of errors. After every change to the Markdown, render once — done. And because no external dependencies are needed, it runs on any machine without prior installation.
The round-trip and the handover to the agent
The end-to-end flow:
Editor (build visually)
   └─ Export ──────────────► Mockup Markdown   ◄── single source of truth
                                   │
                    Renderer ──────┤ (visual check during the meeting)
                                   │
                    Import ◄───────┘ (continue editing)
                                   │
                                   ▼
AI agent (intake / specification)On handover, the orchestrator reads the mockup during the intake/specification step and derives three things from it:
- Clarifying questions from the "Open points / assumptions" section,
- a plan — one task per page or visual,
- acceptance criteria from the corresponding section.
The actual implementation then goes to the executing report agent, which translates the grid references into pixel coordinates using exactly the same conversion the preview uses. The mockup is therefore not a non-binding wish list but feeds the build pipeline's acceptance criteria directly — requirement and verification stem from the same source.
A pleasant side effect of the Markdown basis: version diffs make requirement changes visible. When something changes between two meetings, you see exactly what — one measure more, a filter different, an extra page.
Two common questions
"Does the Mockup Tool only return screenshots?"
No — and that is conceptually the most important point. The binding result is a structured Markdown file, i.e. a machine-readable, versionable blueprint. This file contains everything on the business side: pages, visual types, dimensions, measures (including business definitions), filters, slicer scopes, page types like drill-through and tooltip, visual interactions, and acceptance criteria.
The preview is not a screenshot but a view rendered live from the Markdown — it serves only as a visual check during the meeting and is reproducible at any time. An optional sketch image from the meeting can be attached as a supplement, but it is decorative only, never the basis. The AI agent consumes the Markdown, not an image. An image alone would be worthless for automated processing; the tool's strength lies precisely in capturing the requirement structured rather than pixel-based.
"Should the business fill in the tool itself?"
No. The tool is intended as a facilitated instrument, not as self-service for the business. A specialist — a data analyst or business analyst — fills it in together with the business during the requirements meeting and builds the wireframes, typically via screen share.
This is also legible in the design and deliberately built that way:
- The editor is a collaborative meeting kit ("build together during the meeting"), not a form to fill in alone. The business assembles the page visually and sees a realistic preview immediately — it does not have to type Markdown or understand the grid.
- The division of labor matches the two levels of bindingness exactly: the business supplies the what (key questions, measures, visuals, interactions) — that is binding. The analyst translates it cleanly into the schema, watches for consistency, maintains the technical fields (column/ measure names, formula ideas, grid positions), and captures the open points.
- Concepts like the 12×7 grid, drill-through fields, the interaction matrix, or formula ideas are professional tooling that an analyst commands — leaving it to the business alone would bring back exactly the translation losses the tool is meant to eliminate.
In short: the business brings the domain knowledge, the analyst facilitates and formalizes, and together they produce an agreed mockup during the meeting that then goes to the AI agent as a clean contract.