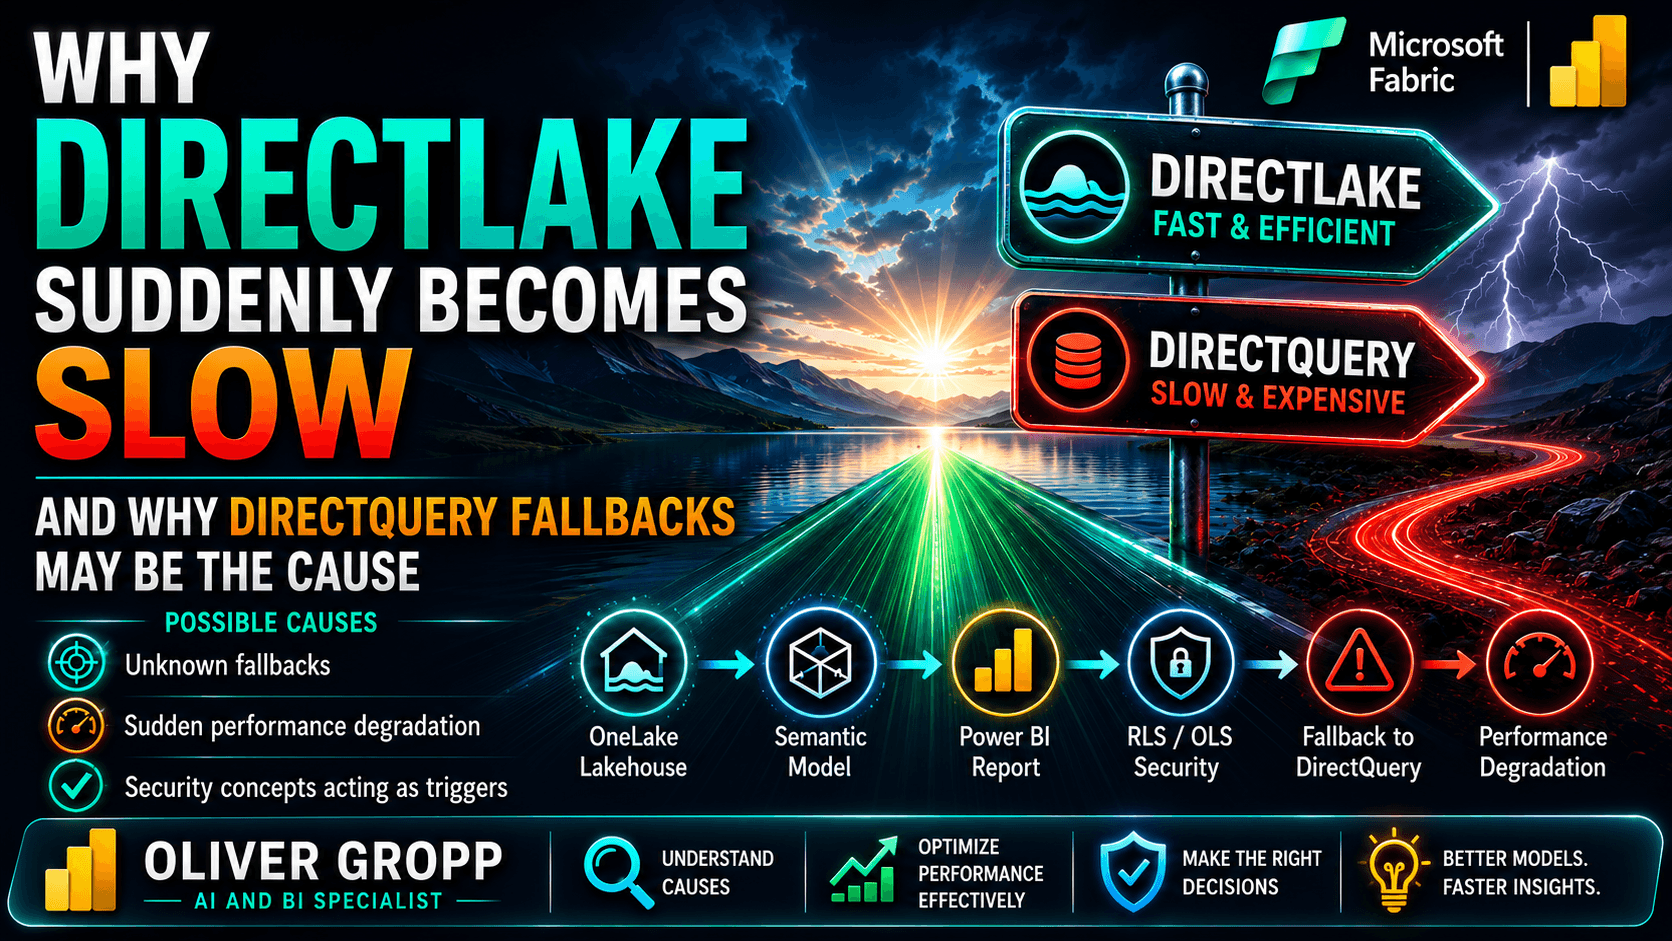
Why DirectLake Models Can Suddenly Become Slower
One statement I keep hearing and reading in Fabric projects is:
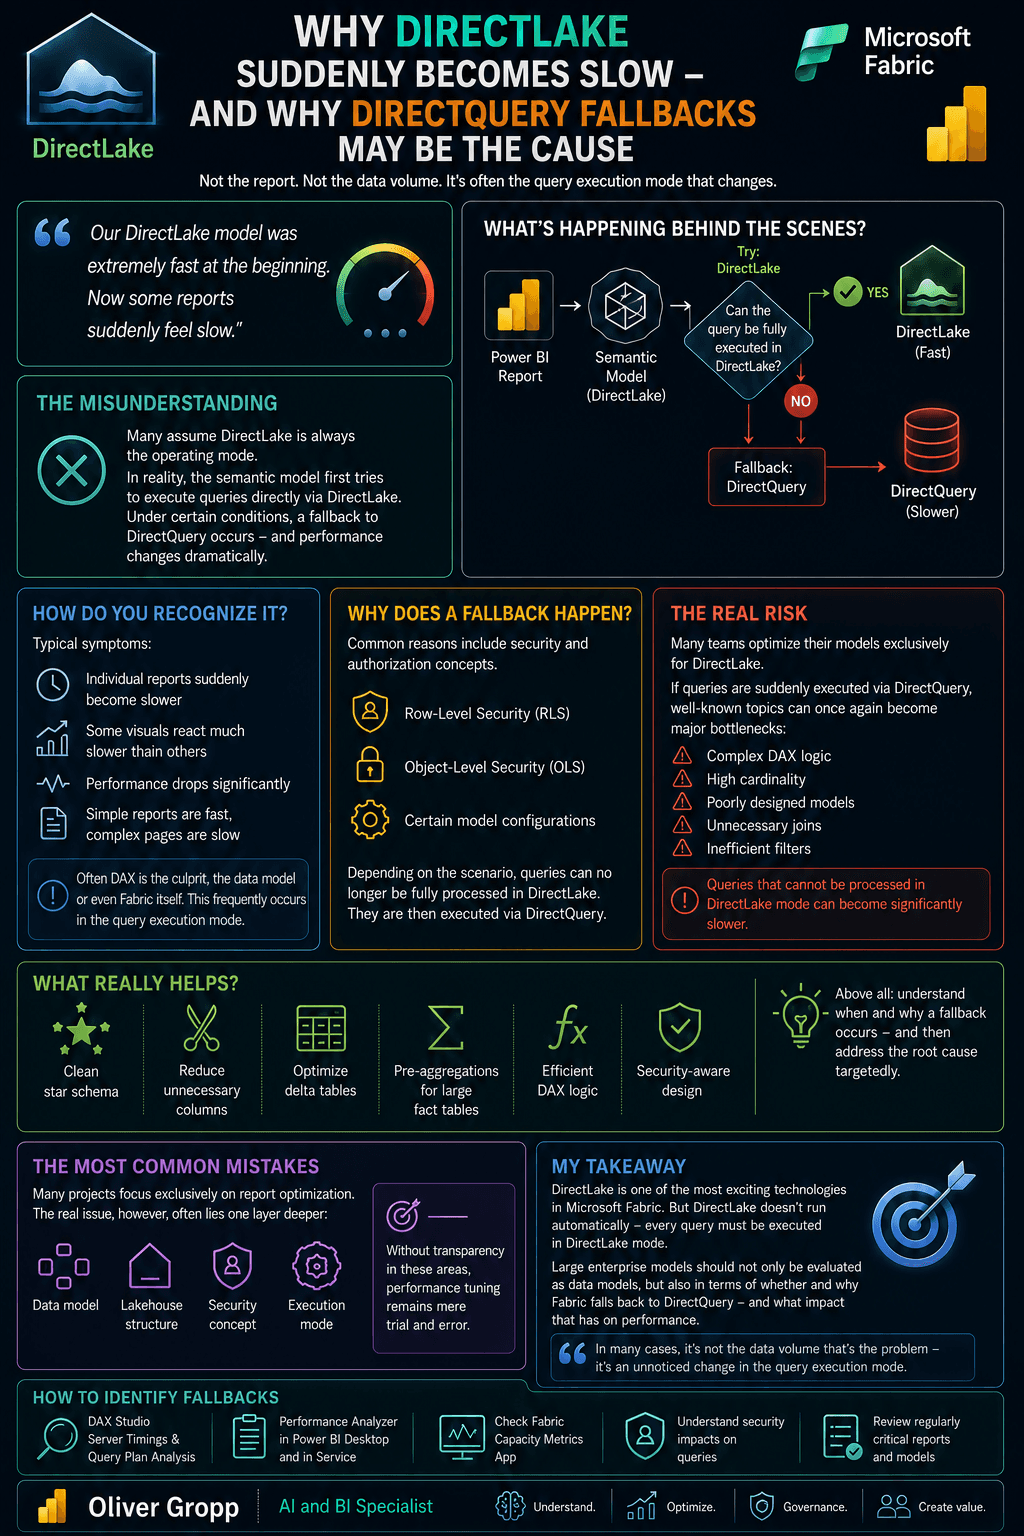
"Our DirectLake model was extremely fast at the beginning. Now some reports have suddenly become slow."
The cause is often not the report itself. Nor is it necessarily the data volume. Quite often, the underlying reason is something many developers are not even aware of:
The Switch from DirectLake to DirectQuery
The Misconception
Many people view DirectLake as an execution mode that is always used.
In reality, the Semantic Model initially attempts to execute queries through DirectLake. However, under certain conditions, it may fall back to DirectQuery.
And that is exactly when performance characteristics can change dramatically.
How Can You Recognize It?
Typical symptoms include:
- Individual reports suddenly becoming slower
- Some visuals responding noticeably slower than others
- Significant performance fluctuations
- Simple reports remaining fast while more complex pages become slow
At that point, DAX, the data model, or even Microsoft Fabric itself is often blamed.
In many cases, however, the real cause lies in the query execution mode.
Why Does a Fallback Occur?
One common reason is security and authorization requirements, for example:
- Row-Level Security (RLS)
- Object-Level Security (OLS)
- Certain model configurations
Depending on the scenario, queries can no longer be processed entirely through DirectLake.
When this happens, Fabric falls back to DirectQuery.
The Real Risk
Many teams optimize their models exclusively for DirectLake.
When DirectQuery is suddenly used, familiar performance issues become much more significant again:
- Complex DAX logic
- High-cardinality columns
- Poor data modeling
- Unnecessary joins
- Inefficient filter paths
Queries that performed perfectly well in DirectLake mode can suddenly become significantly slower.
What Actually Helps?
The most effective optimization levers are:
✅ A clean star schema
✅ Reducing unnecessary columns
✅ Optimized Delta Tables
✅ Pre-aggregations for large fact tables
✅ Efficient DAX logic
✅ A deliberate approach to security concepts
Most importantly, you should understand when and why a fallback occurs in the first place. Only then can the root cause be analyzed effectively.
The Most Common Mistake
Many projects focus exclusively on report optimization.
However, the real problem often lies one layer deeper:
- Data model
- Lakehouse structure
- Security architecture
- Execution mode
Without transparency into these areas, performance tuning quickly becomes little more than guesswork.
My Conclusion
DirectLake is one of the most exciting technologies in Microsoft Fabric.
However, one thing should be clear:
DirectLake does not automatically mean that every query will always be executed in DirectLake mode.
Organizations running large enterprise-scale models should therefore not only understand their data model but also know:
- When Fabric falls back to DirectQuery
- Why that fallback occurs
- What impact it has on overall performance
Because in many cases, the problem is not the volume of data — it is an unnoticed change in the execution mode.